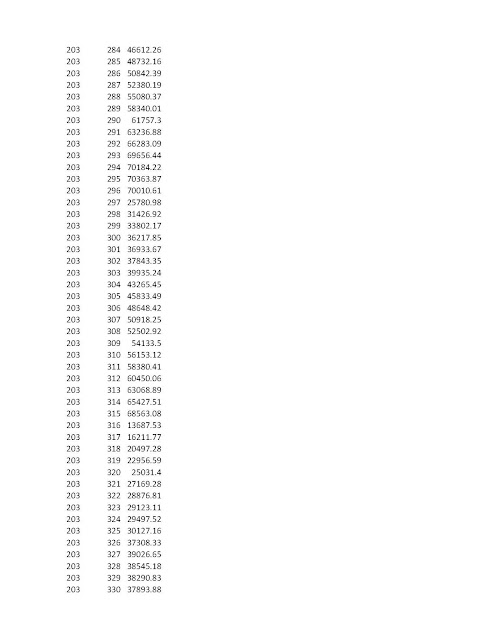
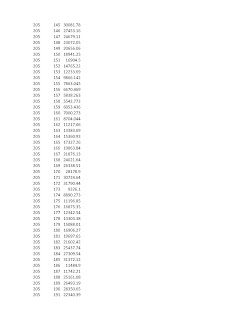
In the map above, produced in ARCGIS, I used a QGIS produced output of K-Nearest Neighbors from the Distance Matrix. I joined that table to a previously produced map layer showing NYC subway stations. I used the previous layer showing the new serial numbers. I joined the layers together using ARCGIS. The results are as follows: From top to bottom for each station:
Station Serial Number
Station Name
Nearest Station Serial Number
Shortest Distance in Feet
Thus for the 14th Street 1st Avenue Station "L Line"
Station Serial # 195
Station Label: 1 AV
Nearest Station to this station: 194 ( 3rd Avenue and 14 Street)
Distance in Feet (straight Line) 1424.2 Feet.
Another Example
Station Serial # 133
Station Name; Astor Place
Nearest Station to this Station: 215 ( 8th Street NYU)
Distance in Feet: 443.466
Dear Visitors:
Please scroll down the page to see present and archive blogs.
Thank you very much: Tramway Null(0)
Thank you very much: Tramway Null(0)
Webrings - Maps - Trolleys and More
Thursday, December 21, 2017
Wednesday, December 20, 2017
How to Calculate Distances between Subway Stations Using ARCGIS and QGIS
In this exercise, we will try to develop a matrx of distances between all subway stations, including Staten Island Rapid Transit. You may do so for your own system that you are interested in. Thus, if we are interested in the new Second Avenue Subway Station at 96th Street and Second Avenue ( my reference number 205 ), we can observe the distance to the 71 St. Forest Hills Station ( Reference Number 427 ). From the chart, we can see that it is 36,457.72 feet, or 6.90487 miles. I only did this analysis for the new Second Avenue Stations ( 203 to 205 Serial Numbers). Thus the 96 th Street Station has 493 distances to all the other stations. This is a large amount of material to post on a log and I am not giving you the serial numbers of all stations. Let me know if you need them.
At any rate, I hope to show you how to do this soon.
To start, you need a mapping program and a shape (*.shp) file. ARCGIS is a big mapping program but it not free. QGIS is a free open source software for maps. Download a shape file for your subway stop locations. If you want to see the line itself, (subway lines), you will need to download a shape file of the subway line. This analysis will use only subway stops.
Once you have a shape file of subway stations, you will need to make a slight alteration to the table that lists all the subway stations. In ARCGIS, the FID identification column begins with a zero. Many distance tools can not read a list that has a unique serial number that begins with zero. In ARCGIS while in the table mode for your shapefile, create a new column. I call mine "Newserial". Use the field calculator to add one to the FID number: NEWSERIAL = FID +1. You will get a serial number that begins with 1 and you can start to do various analysis. Incidentally, the Newserial number is the number that I use to identify the subway stations in this exercise. If you are using ARCGIS and do not have full tool availability (Advanced Package), you will need to bring up the shape station file in QGIS. Bring your vector station file, and then choose, vector, analyst tools and then the Distance Matrix. The unique identifier is the serial number with no duplicates. Choose one of the variations and make sure you designate an output file. Let us say, the your file contains 150 stations, locations, or whatever points you are using to analyze. You will be returned with a csv file with point 1 and 149 locations, point 2 with 149 locations until point 150 with 149 other locations. For the New York City subway system, the number of locals is large so I could not give you all of them. On the map, the Second Avenue Line is not shown, only the stations. Staten Island Rapid Transit stations are also included in the analysis. Staten Island Stations are #493 St George to #473 Tottenville, Far Rockaway Mott Avenue is 451 and Pelham Bay Park is 45.
Therefore, the distance between 2nd Avenue - 96 Street (Ref. 205) to Tottenville, (Ref. 473) is 130, 162.6 feet or 24.65 miles as the birds fly.
Tramway Null()
Monday, December 4, 2017
New York's 4th Regional Plan Suggests some Streetcar Routes for NYC but does not give details.
This map comes from the NY Regional Plan (4th) where the blue lines are proposed light rail\streetcar routes (other than the BQX). I could not find out more information about the proposals. The blue line from Bay Ridge to Marine Parkway Bridge; is that line going down 65th Street? What about the other lines; is that a concourse line in the Bronx?
Tuesday, November 14, 2017
Wellington's Trolleybuses also end on October 31, - November 1 - 2017
On 31.10.2017 the trolleybuses drove on Wellington's streets for the last time. A total of 29 trolleybuses were used on the last day of operation on lines 1, 2, 3, 7, 9 and 10. The wagons 387, 383 and 384 moved in as the last three trolleybuses, behind car 384 the gates for the trolleybuses closed forever at 0:45 am on 1.11.2017. ... more
It is funny that Wellington lost it's trollebuses on October 31 61 years after Brooklyn lost its trams and the Cortelyou Rd trolleybus.
News note above comes from Trolleymotion.
It is funny that Wellington lost it's trollebuses on October 31 61 years after Brooklyn lost its trams and the Cortelyou Rd trolleybus.
News note above comes from Trolleymotion.
As one writer many years ago in the ERA Headlights wrote in the October edition: FINE
Monday, November 13, 2017
Experiments with Trolley Trucks Continue in Los Angeles California
See the link below:
https://cleantechnica.com/2017/11/12/siemens-ehighway-heavy-duty-trucks-continue-california/
The experimental Los Angeles - Long Beach trolley truck line was presented before the public last week and will be tested during the coming year. Many organizations are involved, including the Los Angeles MTA. I wish them success and perhaps having an overhead over a highway we make people who make decisions re-look at interurban trolleybus applications. Local trolleybus new starts are little and some big users of trolleybuses are considering or already abandoned their systems (for example, Philadelphia, Moscow, Wellington...).
To be continued.
Monday, November 6, 2017
Data Scrapping for Transportation Info using "R"
Recently, I was exposed to data mining and data scrapping using "R" which is a statistical relating language which has geospatial capability. In a recent "R" blog, it was shown how to use "R" to data scrape the US census information from the "American Community Survey" for 2015. I found one variable that is transit related and it is labeled "PublicTrans". I do not know what it measures but you are able to bring it up for selected cities using code. There are over 500 variables dealing with the census and it is a nice resource to know about. Some code is shown below. More to follow.
Package‘census’ October 26, 2017
Type Package Title Scrape US Census Data Version 0.2.0 Maintainer Danny Malter <danmalter@gmail.com> Description A scraper to collect US Census data from the American Community Survey (ACS) data andmetadata.Availabledatasetsincludepopulation,income,educationandemploymentlevelsby age,sexandrace.See<http://mcdc.missouri.edu/websas/caps10acsb.html>formoreinformation. Unlike other census related packages, this package does not require a U.S. Census Bureau API. URL https://github.com/danmalter/census BugReports https://github.com/danmalter/census/issues Depends R (>= 3.2.0), ggmap, RCurl, utils Suggests knitr, rmarkdown, ggplot2, proto, RgoogleMaps, png, rjson, mapproj, jpeg, geosphere, bitops License MIT + file LICENSE Encoding UTF-8 LazyData true RoxygenNote 6.0.1 VignetteBuilder knitr NeedsCompilation no Author Danny Malter [aut, cre] Repository CRAN Date/Publication 2017-10-26 08:30:33 UTC
Rtopicsdocumented:
getCensus . . . . . . . . . . . . . . . . . . . . . . . . . . . . . . . . . . . . . . . . . . 2
Index 3
1
2 getCensus
df[1:5, c("sitename","radius","TotPop","pctMales","pctFemales","AvgFamInc","pctPrivWageWorkers","pctGovWorkers", "pctMarried","pctBachelors","MedianHValue","PublicTrans")]
sitename radius TotPop pctMales pctFemales AvgFamInc pctPrivWageWorkers pctGovWorkers pctMarried pctBachelors MedianHValue
1 Chicago 10 2,530,608 48.8 51.2 $87,982 84.7 10.4 35.0 21.8 $269,295
2 New York 10 6,933,559 48.1 51.9 $100,221 81.5 11.7 39.0 22.8 $604,431
3 Detroit 10 876,392 48.1 51.9 $51,019 85.0 10.4 28.9 9.4 $66,165
4 Seattle 10 1,035,736 50.2 49.8 $134,413 81.0 12.7 45.0 33.6 $498,553
NA <NA> <NA> <NA> <NA> <NA> <NA> <NA> <NA> <NA> <NA> <NA>
PublicTrans
1 330,175
2 1,829,436
3 18,024
4 96,355
NA <NA>
sitename radius
TotPop pctMales pctFemales AvgFamInc pctPrivWageWorkers pctGovWorkers
pctMarried pctBachelors MedianHValue PublicTrans
1 Chicago 8 1,815,448 49.2
50.8 $91,510 85.7 9.5 33.5 23.4 $293,622 261,837
2 New York 8 5,224,374 48.1
51.9 $109,275 81.8 11.2 38.6 24.4 $668,262
1,482,966
3 Detroit 8
536,864 48.2 51.8
$45,772 84.7 10.8 26.5 8.5 $59,365 12,835
4 Los Angeles 8 2,588,438 49.6
50.4 $64,993 79.8 9.4 36.1 17.0 $486,128 161,261
5 Seattle 8
750,999 50.2 49.8
$141,393 80.5 13.2 42.6 35.0 $526,929 78,862
6 Boston 8 1,426,011 48.1
51.9 $114,584 84.3 10.3 36.9 24.9 $481,422 214,912
7 Philadelphia 8 1,718,692 47.2
52.8 $73,323 83.6 12.1 30.4 15.8 $177,031 172,100
8 San Francisco 8
1,017,777 50.6 49.4
$134,464 79.6 11.7 40.0 31.7 $831,206 172,455
Tuesday, October 31, 2017
We Miss You
This a Joe Testagrose picture taken from the Dave's Rail Pix site. It shows a McDonald PCC car on Shell Road south of 86th Street sometime between 1951 and the last day of service on October 31, 1956. The Culver El structure is in the background. This portion of the line used steel from the Fulton Street Elevated and thus looks different than other el girders built around 1914-1920. The Coney Island gas tanks are also in view and perhaps BMT "C" type el cars in the background.
A few years ago, a proposal for a new streetcar line on the Brooklyn - Queens waterfront was established. By April 2017, a detailed statement dealing with the route and costs were supposed to be made public. Nothing was heard since April and the rumor is that this project is in trouble because of the source of funding. Thus it appears that this project ended up like all the other trolley projects proposed for Brooklyn and Manhattan. You know what I miss? Even though a trolley was a few blocks away, the wire started to vibrate and you heard a swishhhiing sound, something like a bird tweet. This was caused by the vibration of the trolley power wire by the trolley pole. It is unlikely that this will ever be heard again in Brooklyn or New York City. Notice on the el structure that at that time, no outside cat walks were provided for workers.
A few years ago, a proposal for a new streetcar line on the Brooklyn - Queens waterfront was established. By April 2017, a detailed statement dealing with the route and costs were supposed to be made public. Nothing was heard since April and the rumor is that this project is in trouble because of the source of funding. Thus it appears that this project ended up like all the other trolley projects proposed for Brooklyn and Manhattan. You know what I miss? Even though a trolley was a few blocks away, the wire started to vibrate and you heard a swishhhiing sound, something like a bird tweet. This was caused by the vibration of the trolley power wire by the trolley pole. It is unlikely that this will ever be heard again in Brooklyn or New York City. Notice on the el structure that at that time, no outside cat walks were provided for workers.
Wednesday, October 25, 2017
You Want A Seat Near a Window? How about No Seats at All?
http://www.mta.info/news/2017/10/03/subway-action-plan-update-new-subway-cars-e-line
From the MTA website, a picture of a R-160 class on the "E" Line. It appears that the end seats, that give you a sideways view of the outside, will be eliminated. At another source, regarding the heavily used "L" train (14th Street - Canarsie Line), entire benches will be folded up and locked. The philosophy behind this is to fit more passengers in the car, while all the other systems, such as tracks, signals, power and so on are failing. The elimination of car seats is an experiment however. For those persons who are taking longer trips, who are disabled, elderly or pregnant, this may cause a problem however. It seems to me, that from over 100 years ago, the wonderful BMT standard cars, types A and B, had many seats near windows and seats in all configurations, with a great deal of standing room. These 67 foot cars had only three entrances per side and the conductor's position was in the middle. I do not know what to say, but I believe that all these transit related problems that we had here in New York over the past few years will result in individuals and businesses fleeing the city.
Subscribe to:
Posts (Atom)


