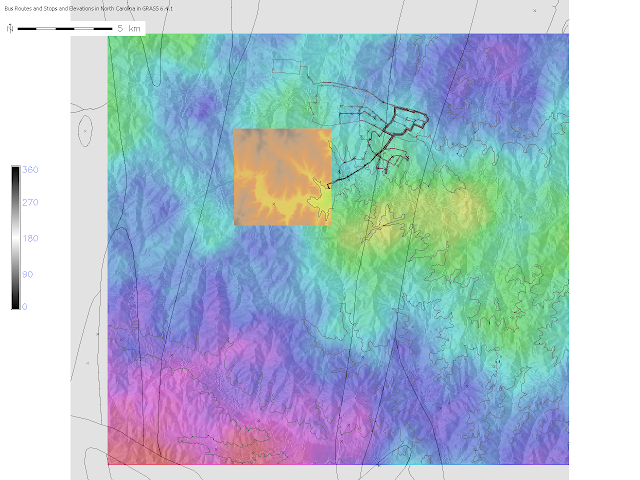
 In the map below, the street grid was brought in. Bus routes in black and railroads in red. GRASS 6.4.1 is cool to work with, but it is a little unstable at times. Great colors! The colors represent elevations from their fractal or other elevation data sets.
In the map below, an aerial photograph was brought in. Elevation is hinted by the slight change of colors.
In the map above, a hydrology experiment was done in which the street layer was used as the basis of the stream layer. An elevation fle was brought in and a map was produced showing critical stream areas (blue X's) at low points along the streets. Done using GRASS 6.4.1 Hydrology program.
In the map below, streams, indicated by red dots, were used as the basis of the hydrology study and the results shown in light green, are areas of flooding, according to this experiment.


No comments:
Post a Comment