
Elevation in feet 

DXY

DYY

 DYY
DYY DY
DY
Aspect

Slope Raster

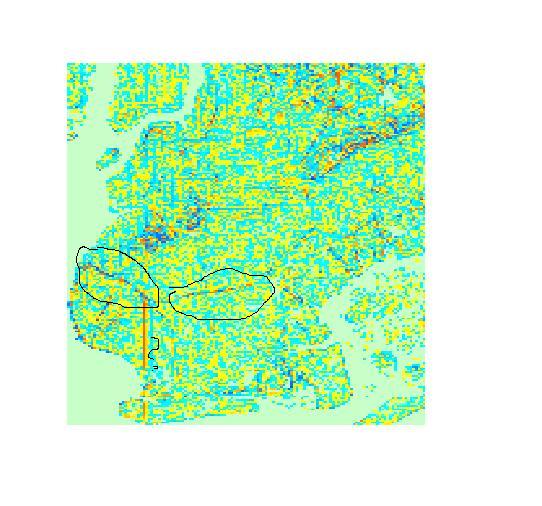
Profile Curv. Bay Ridge RR Circled
DX

In the above experiment, I took the raster elevation file of New York City and I analyzed it using GRASS 6.4.1 under Terraine Analysis - Slope and Aspect option. I did not include any railroad or subway shape files. GRASS 6.4.1 gives the option of producing maps analyzing the slope according to various derivatives and the results are shown above. Although the resolution is not the best, you can make out various railroad cuts, such as the LIRR Bay Ridge Division Cut that runs from west to east in an arc. You can see the shadows of various elevated lines, including the Culver Line as well. Although not clear as posted, in the Red Hook area you can make out faintly the Culver Viaduct. My guess is that if someone is trying to find the path of a past railroad or interurban or other railroad and the person has a good elevation file and a program similar to GRASS, the analyst can find the location of it using this or similar techniques if a good map is not available. Notice the vertical line that approaches the Coney Island Creek and continues in Coney Island. I do not believe that this is Cropsey Avenue and it may be some sort of computer error.
Tramway Null(0)

 Shaded relief Analysis
No comments:
Post a Comment